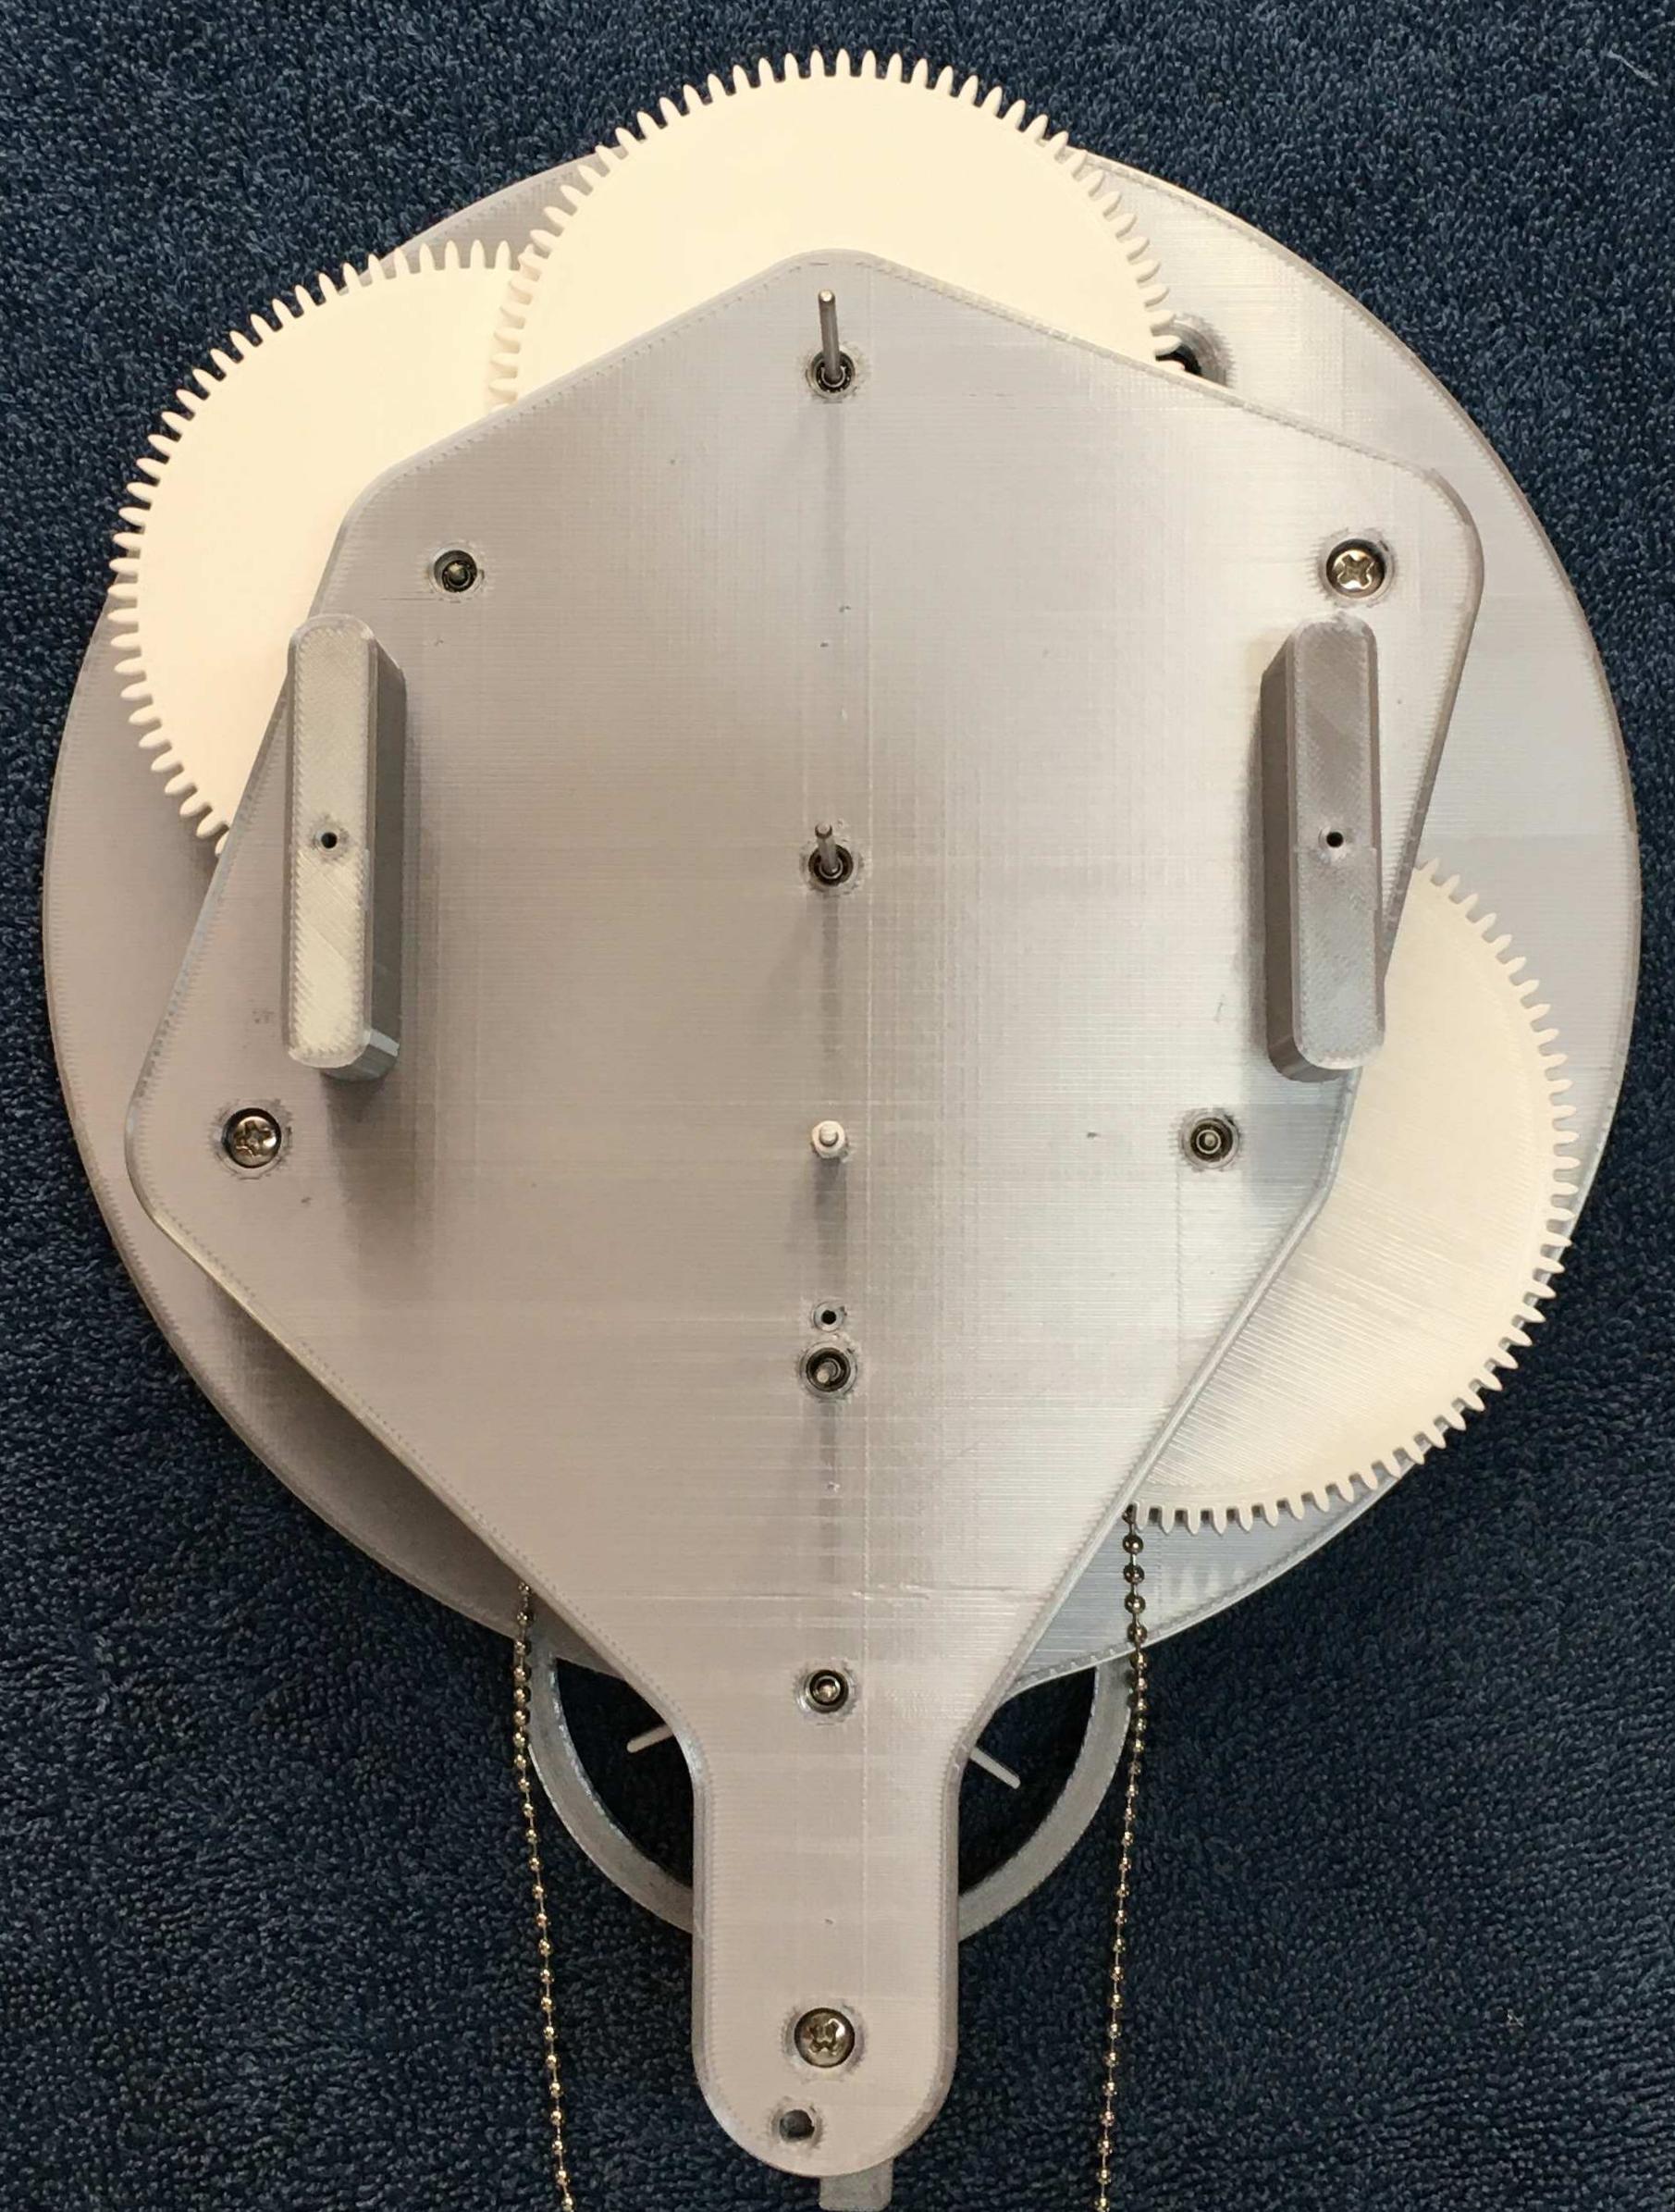
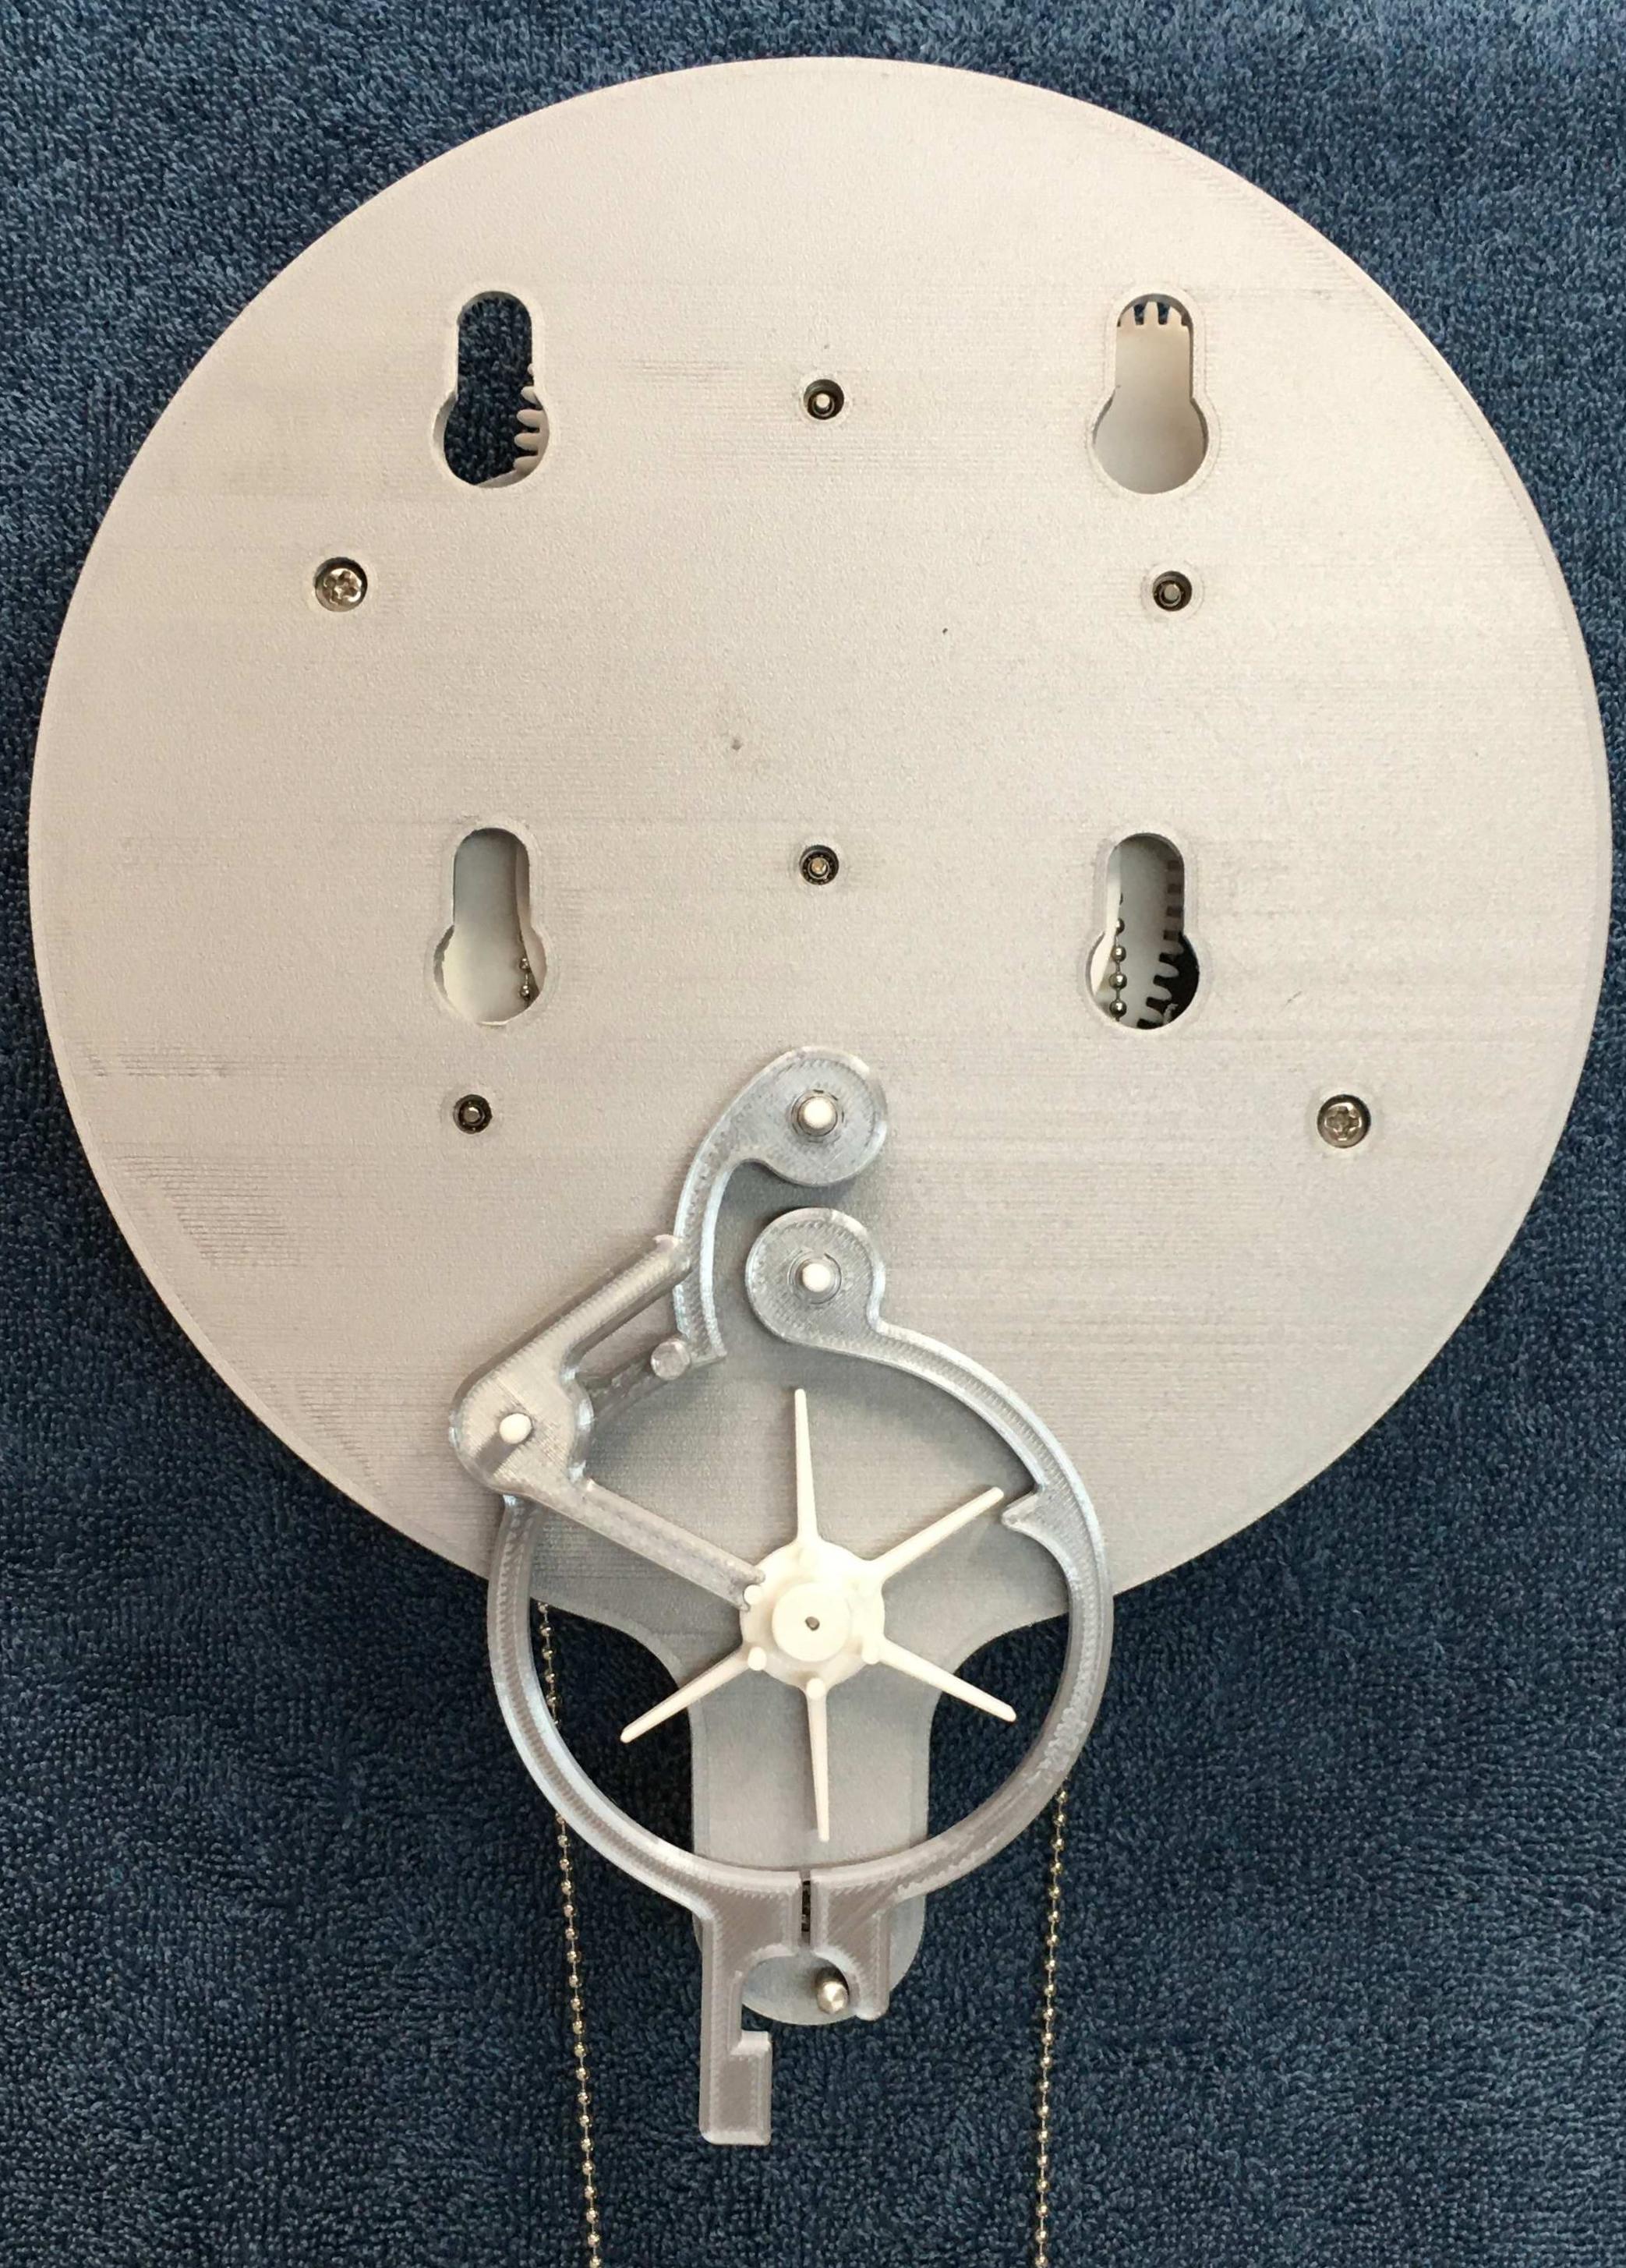
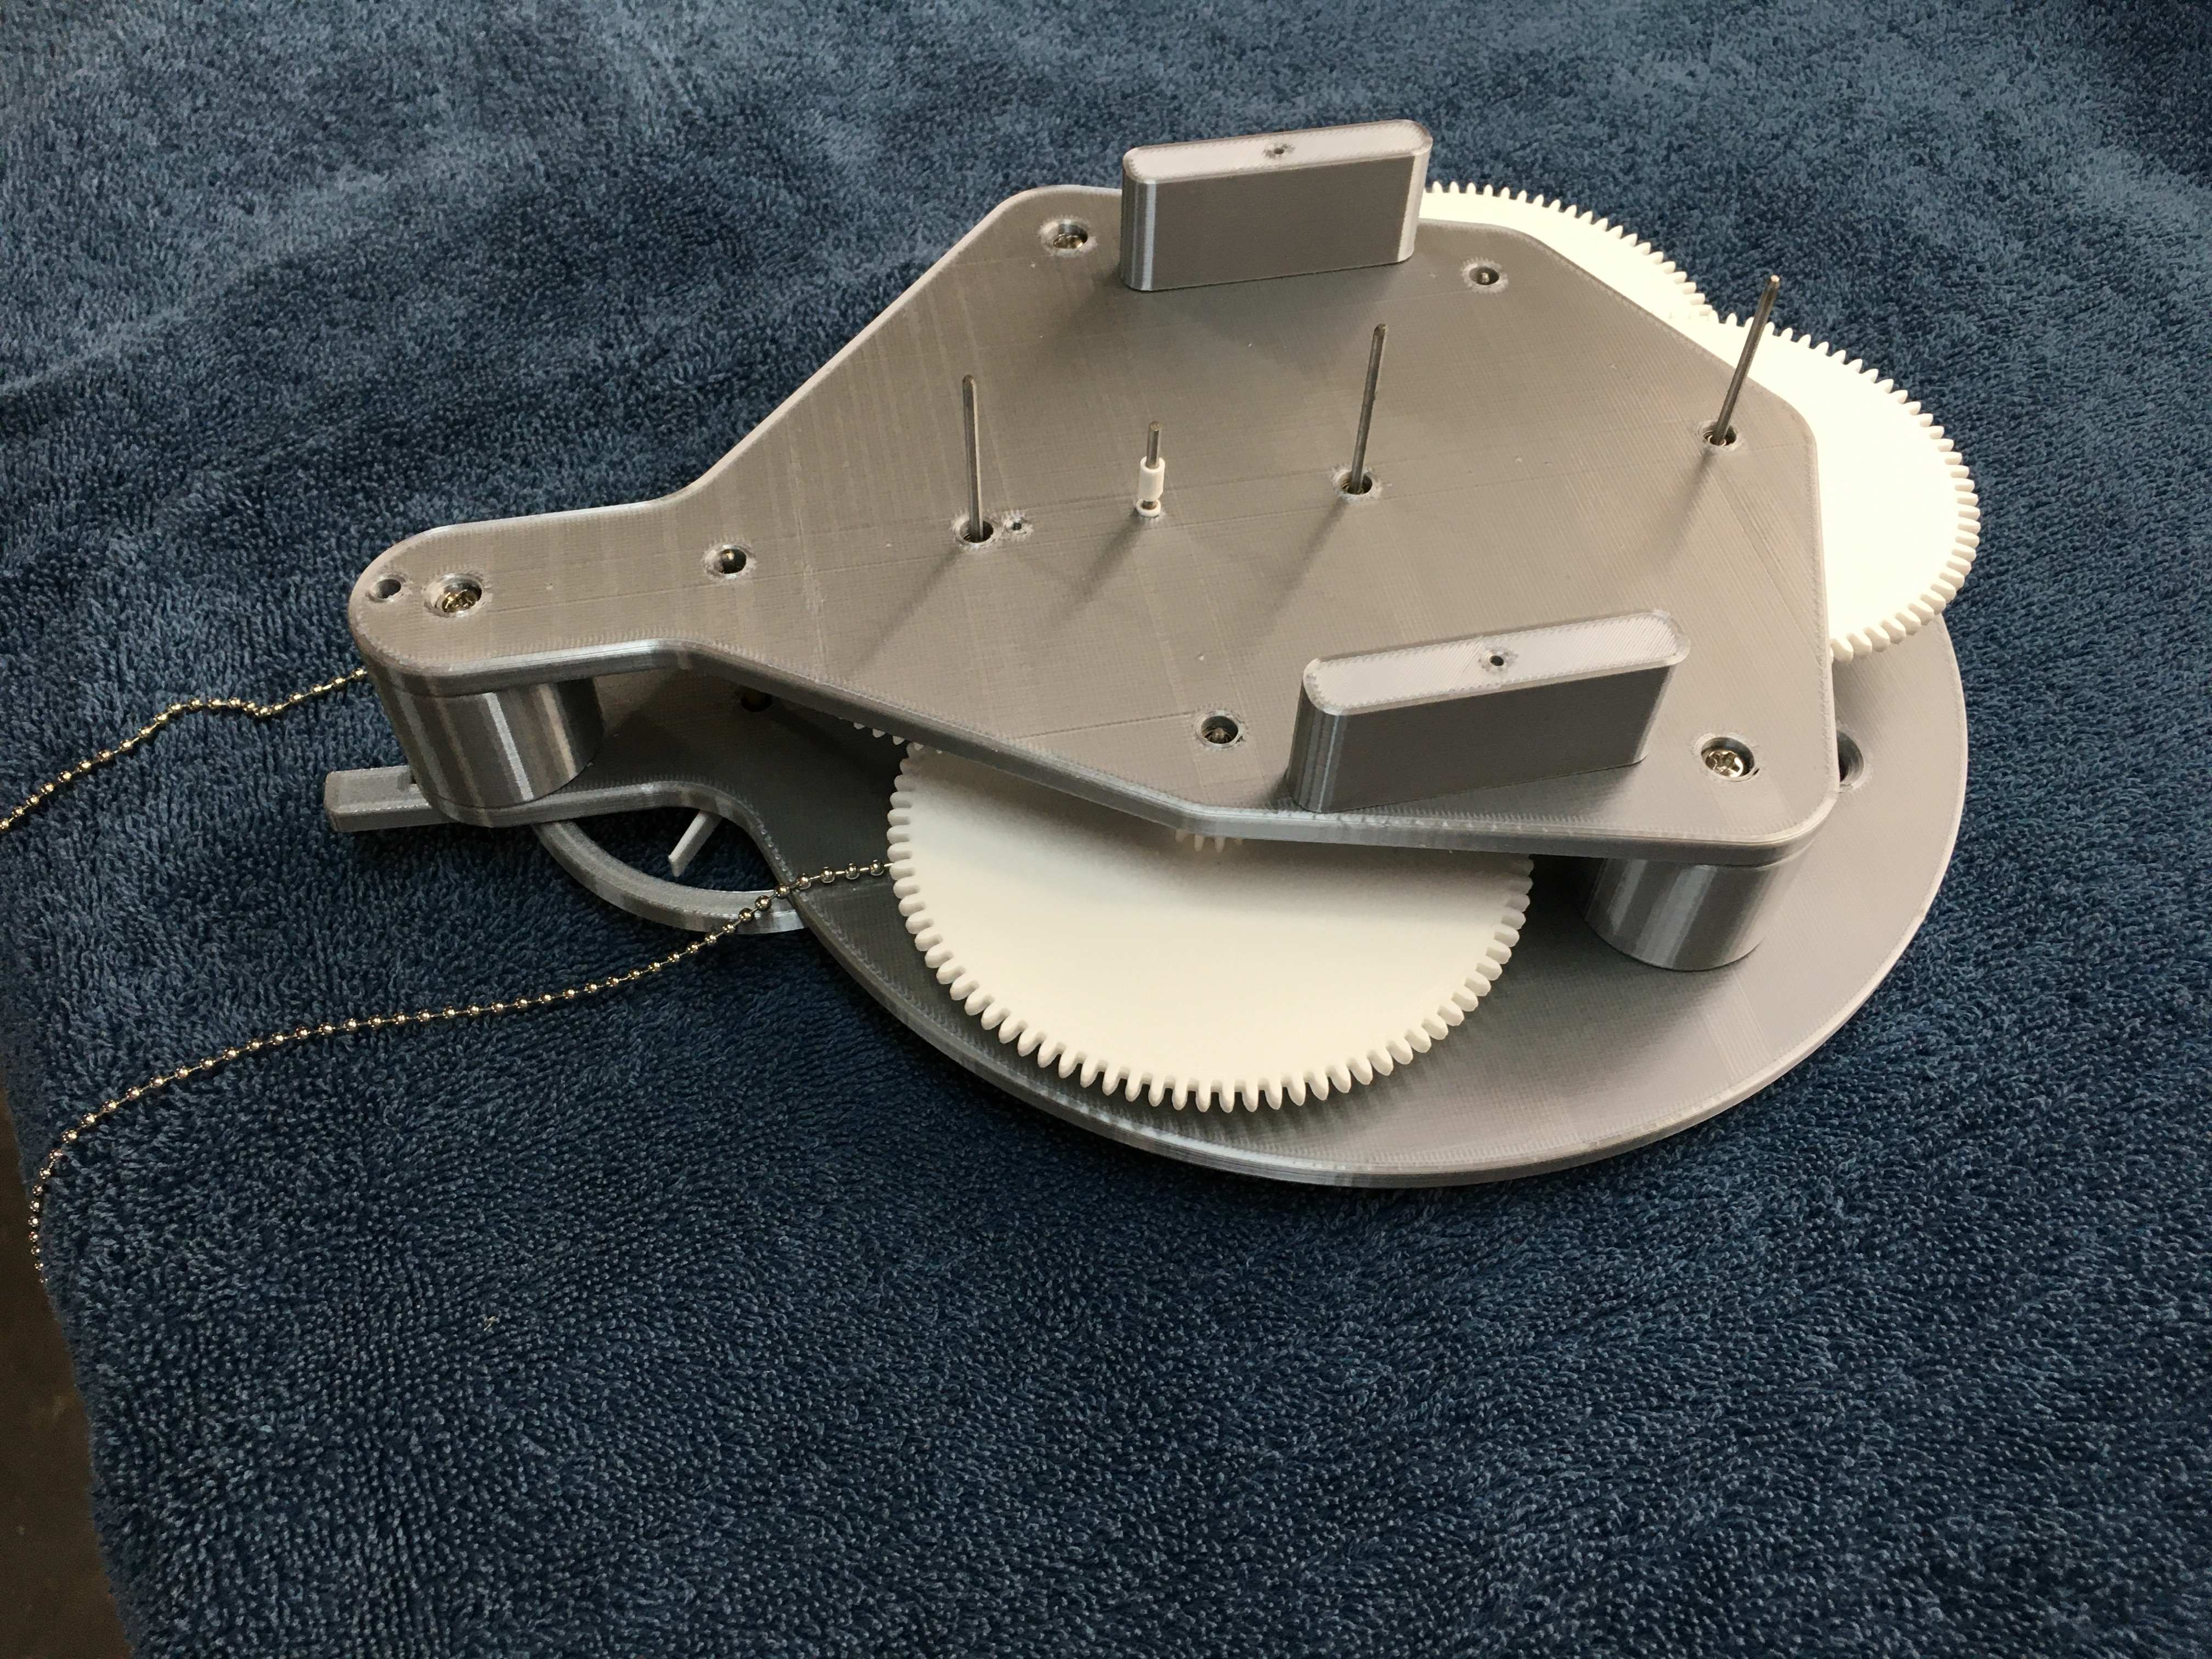
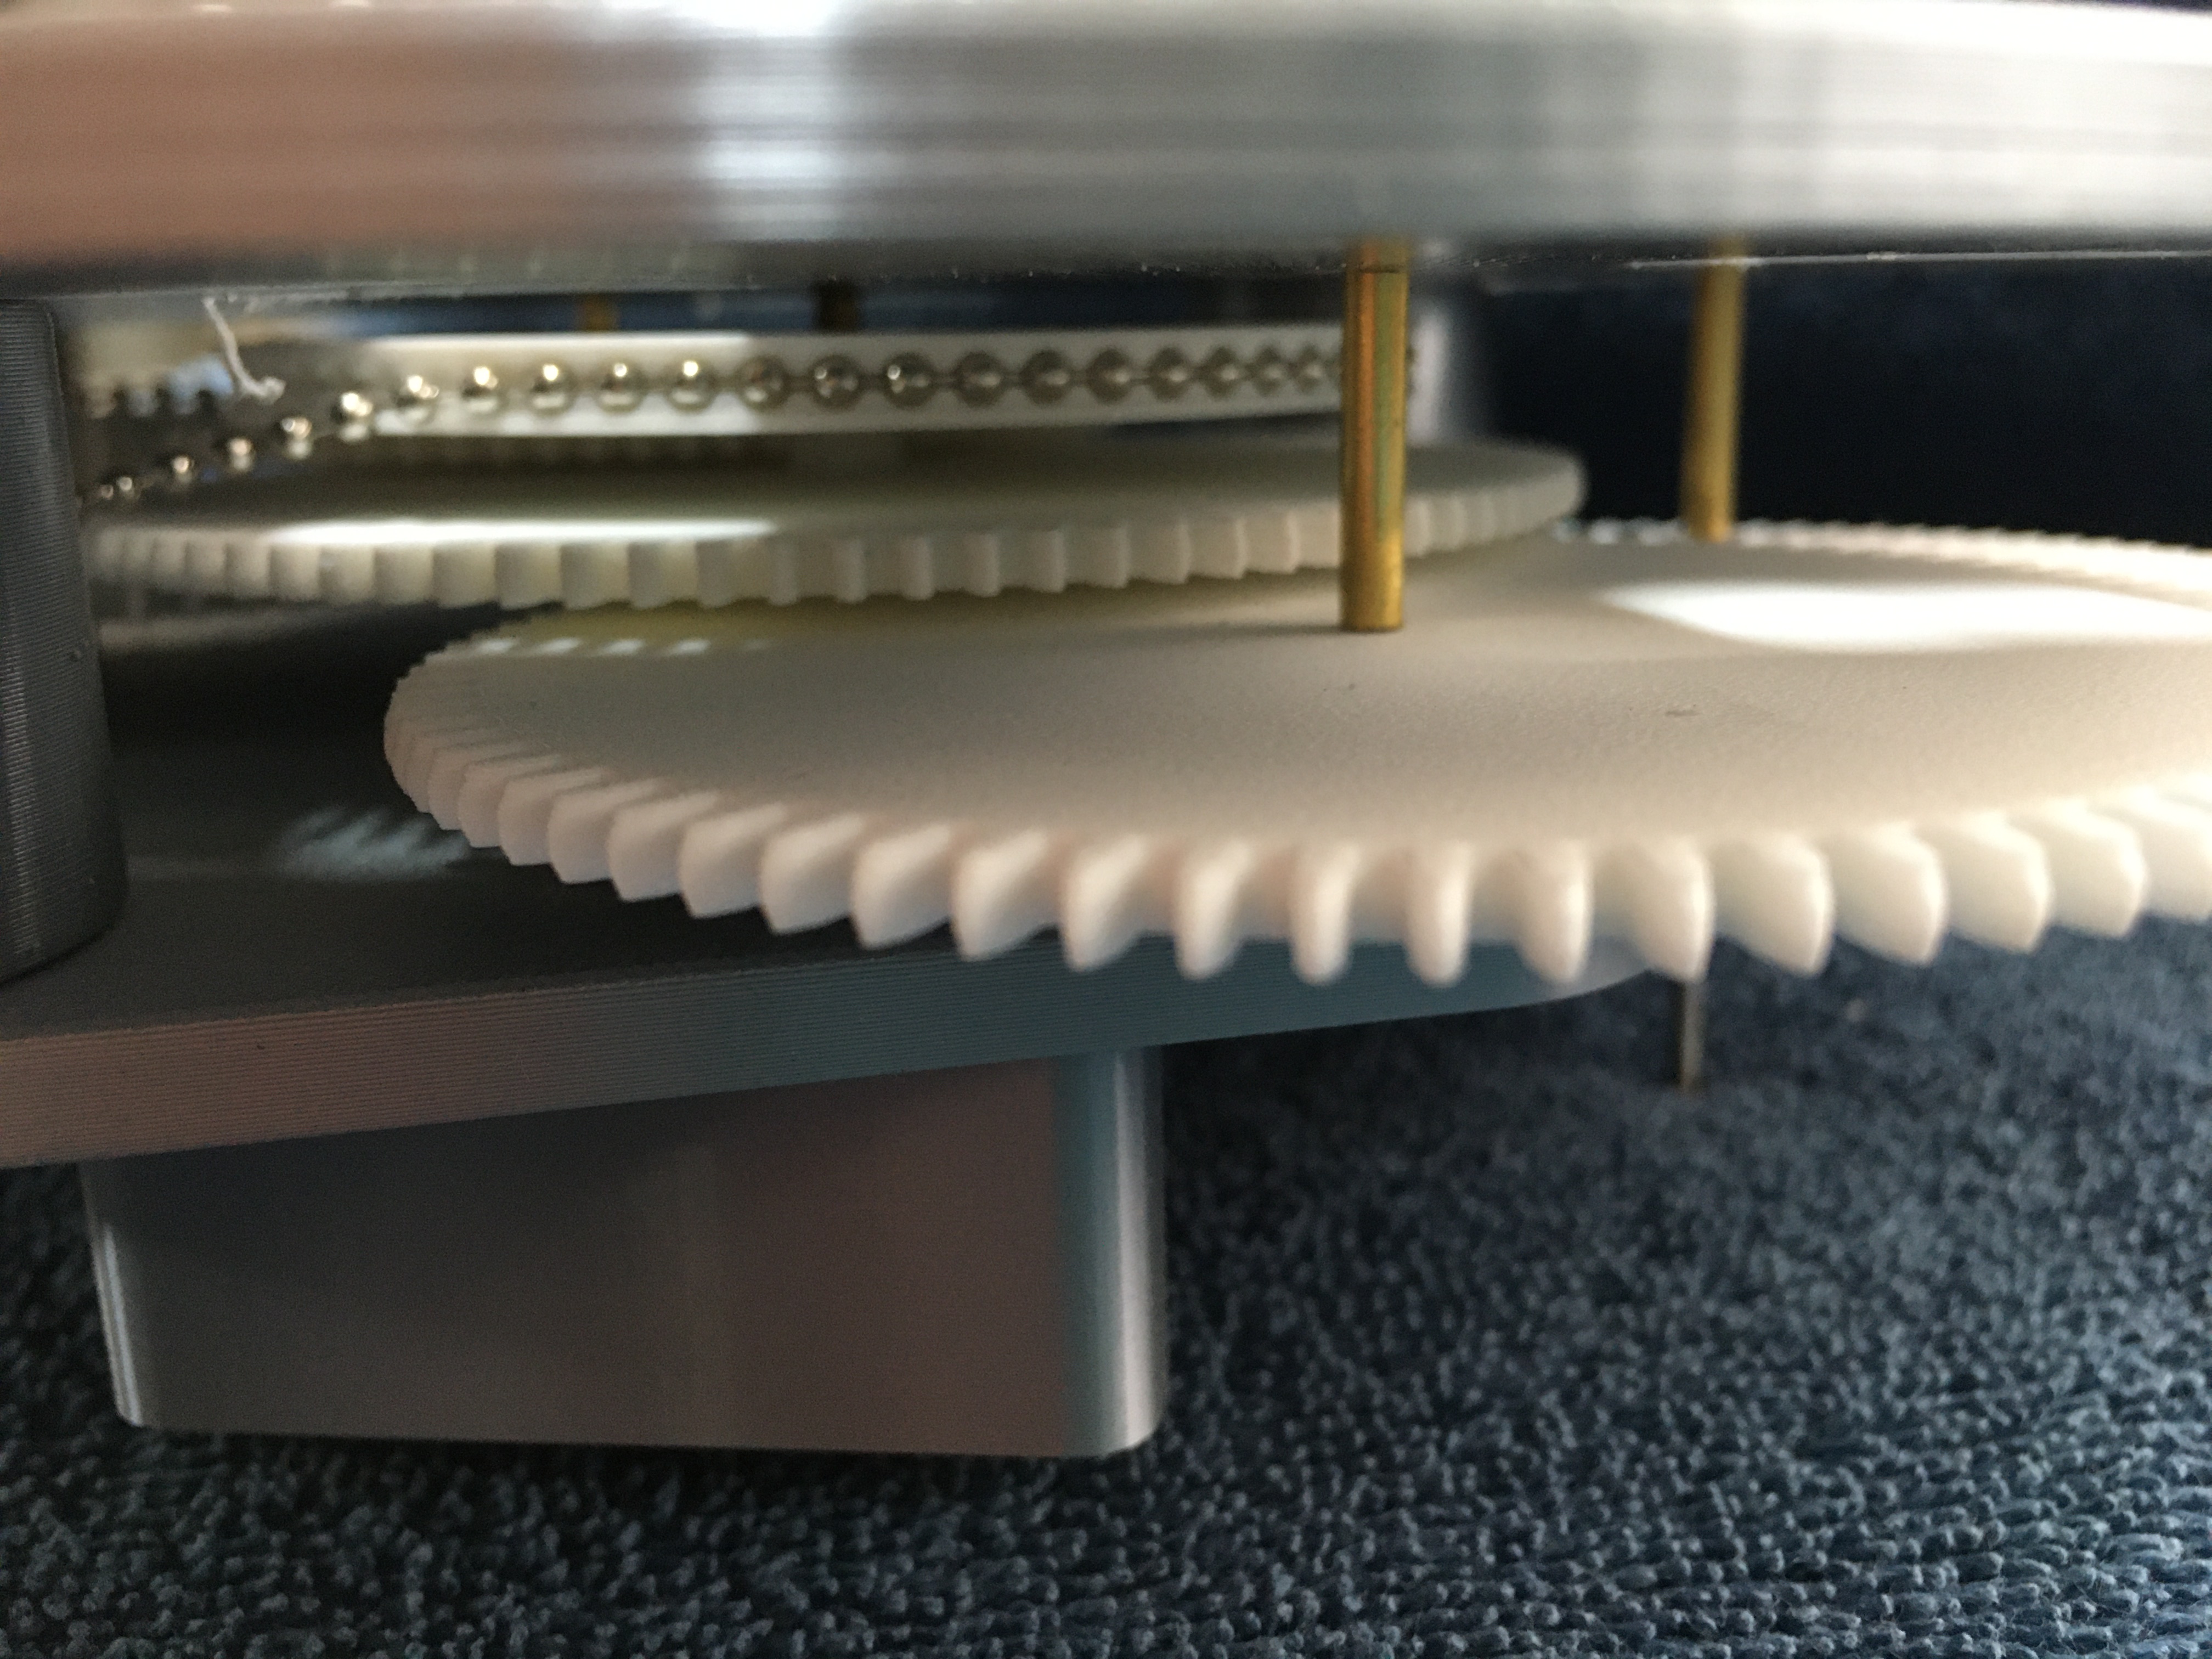
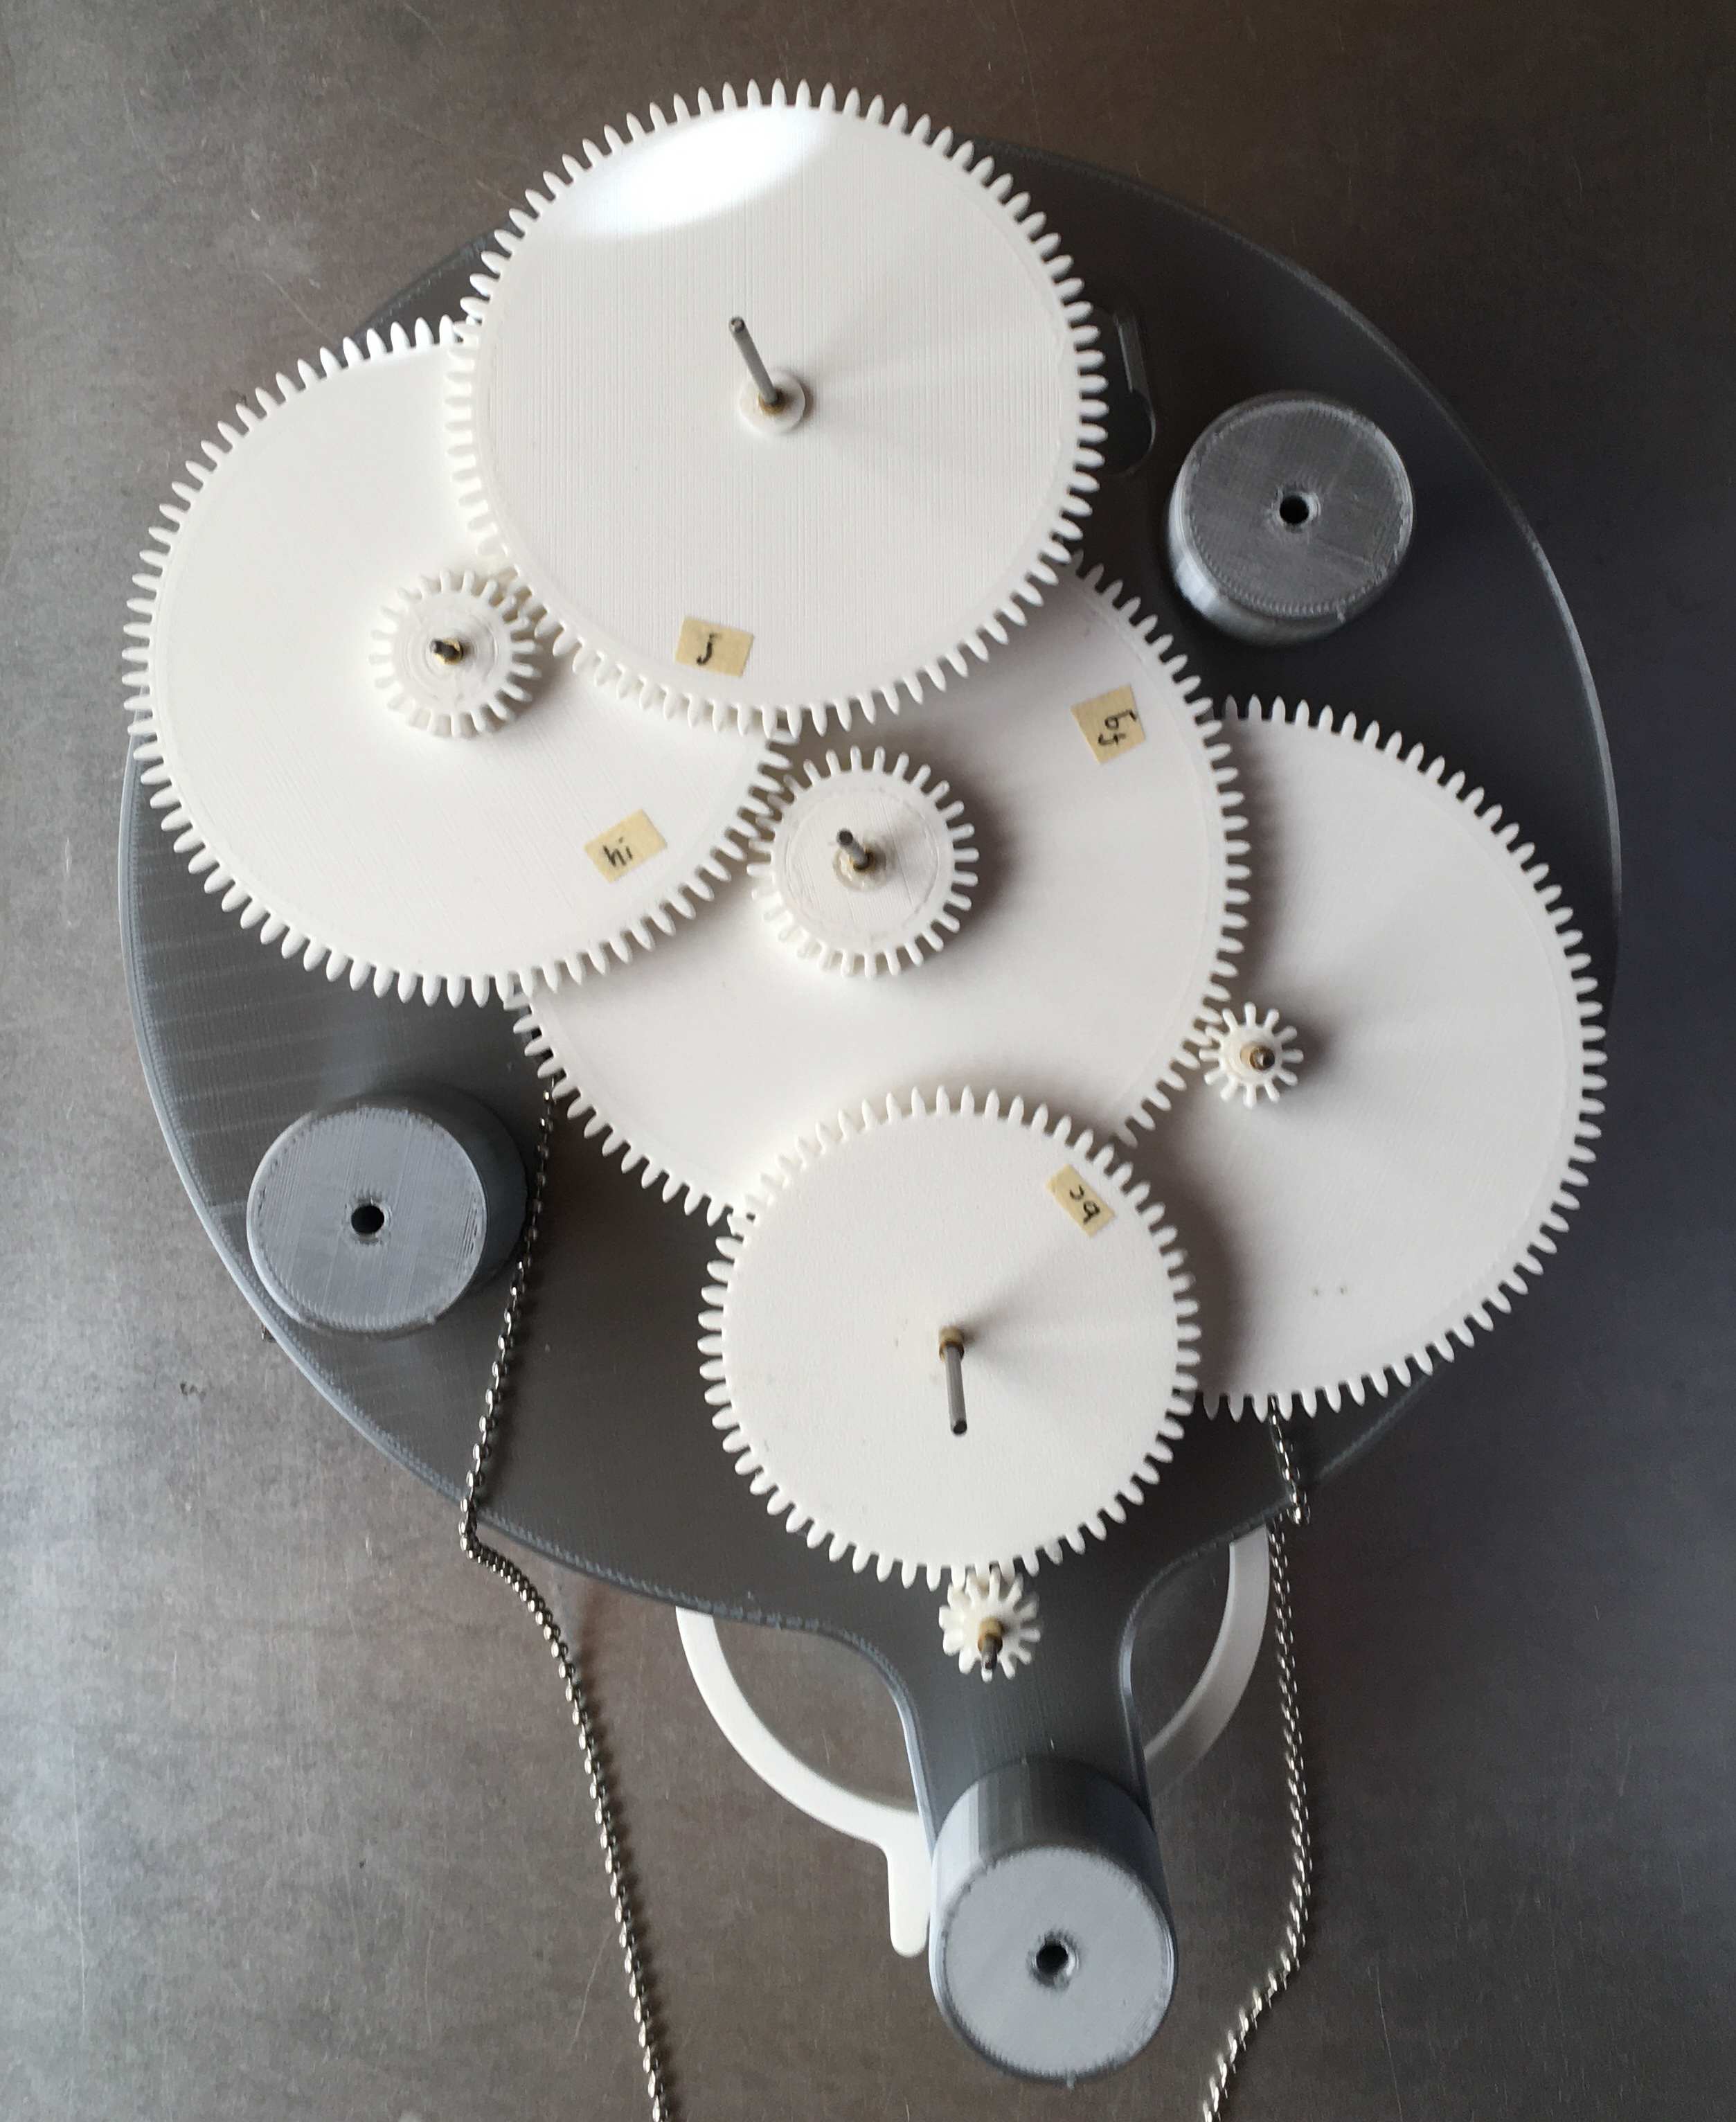
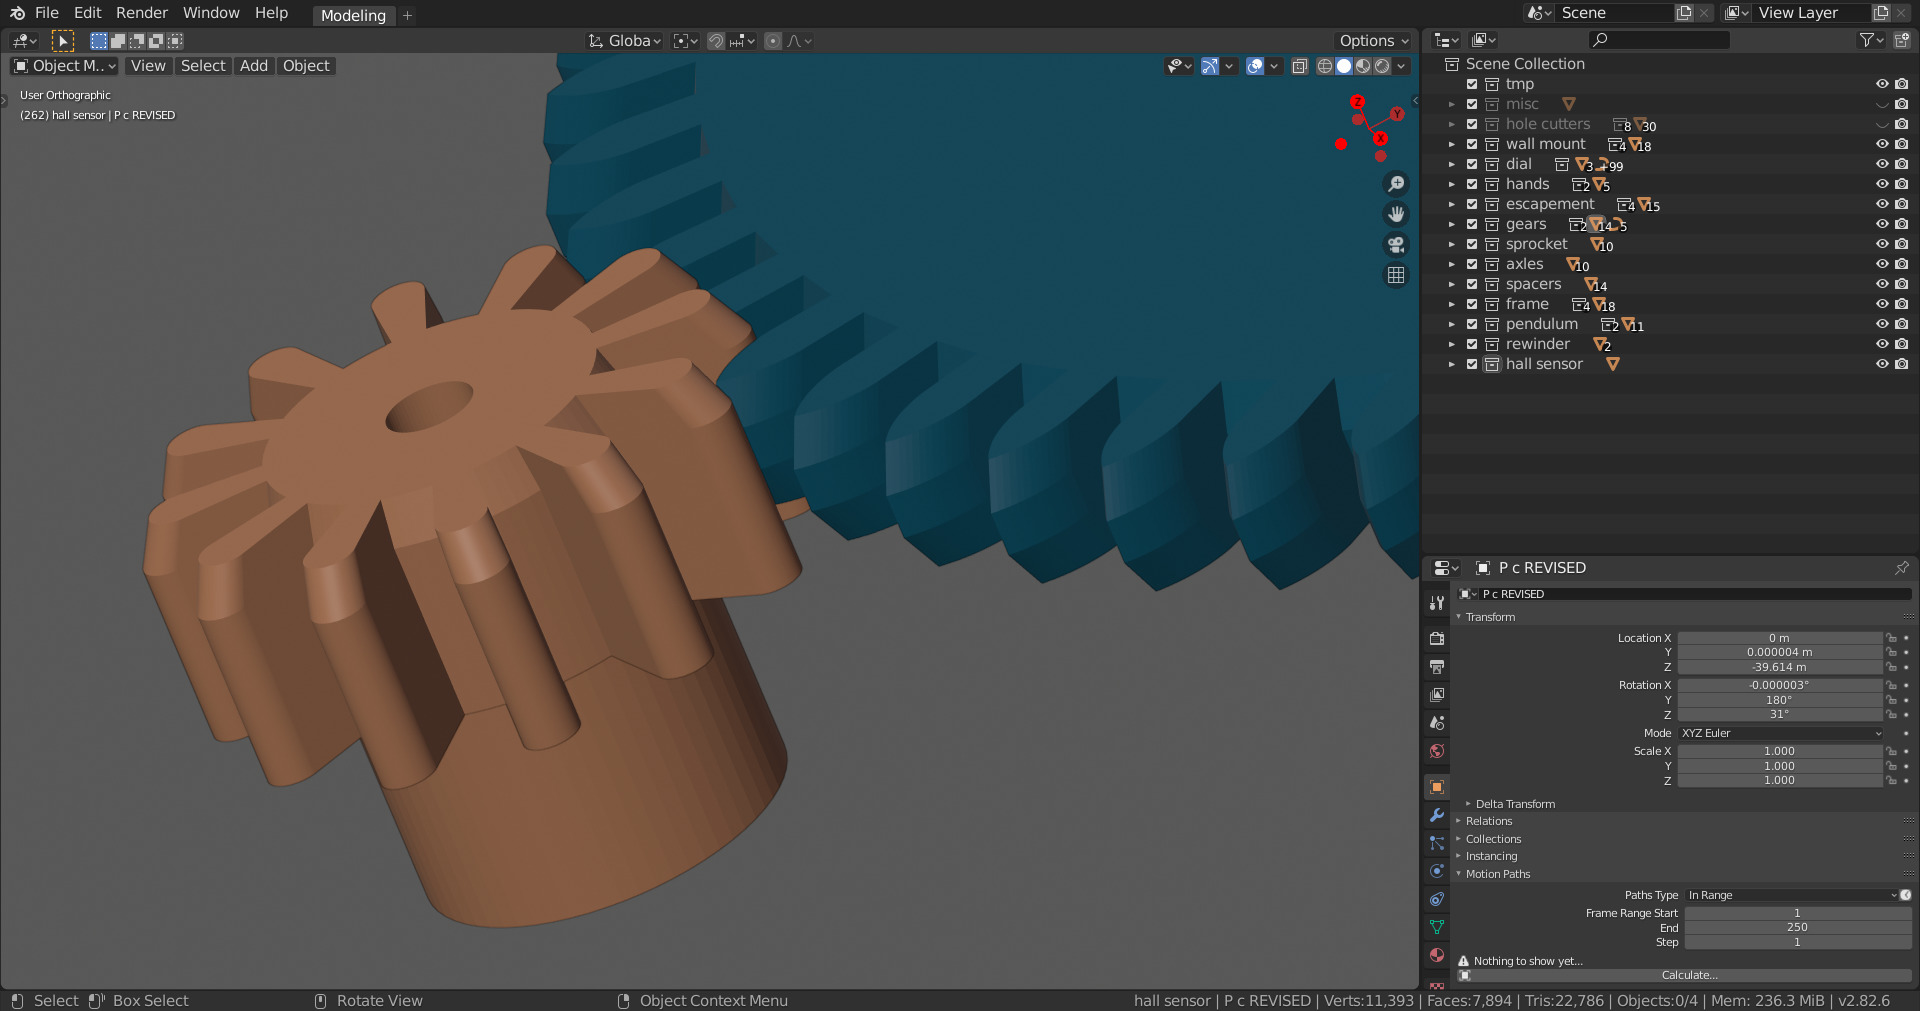
The gears have cycloidal profiles and run on 2mm steel shafts turning in miniature ball bearings with brass sleeves to set the gear positions axially. End play is fine tuned by sliding the ball bearings in their friction fit mounting holes. The escapement is an Arnfield design with 6 steps per revolution. The pendulum uses a carbon fiber rod and has a 2 second period.
A microcontroller monitors the clock's performance. Its timebase is controlled using a GPS satellite receiver and has microsecond resolution. It has sensors to record the pendulum swing rate, ambient temperature, and barometric pressure. The data is transmitted over wifi to my laptop for graphing and analysis.
The clock is weight driven using a ball chain and sprocket with a Huygens type pulley arrangement. A miniature gear motor activates at 6 hour intervals to rewind the weights, stopping when a magnetic sensor detects that the rewind has completed.
Derek Lieber
13 Nov 2023
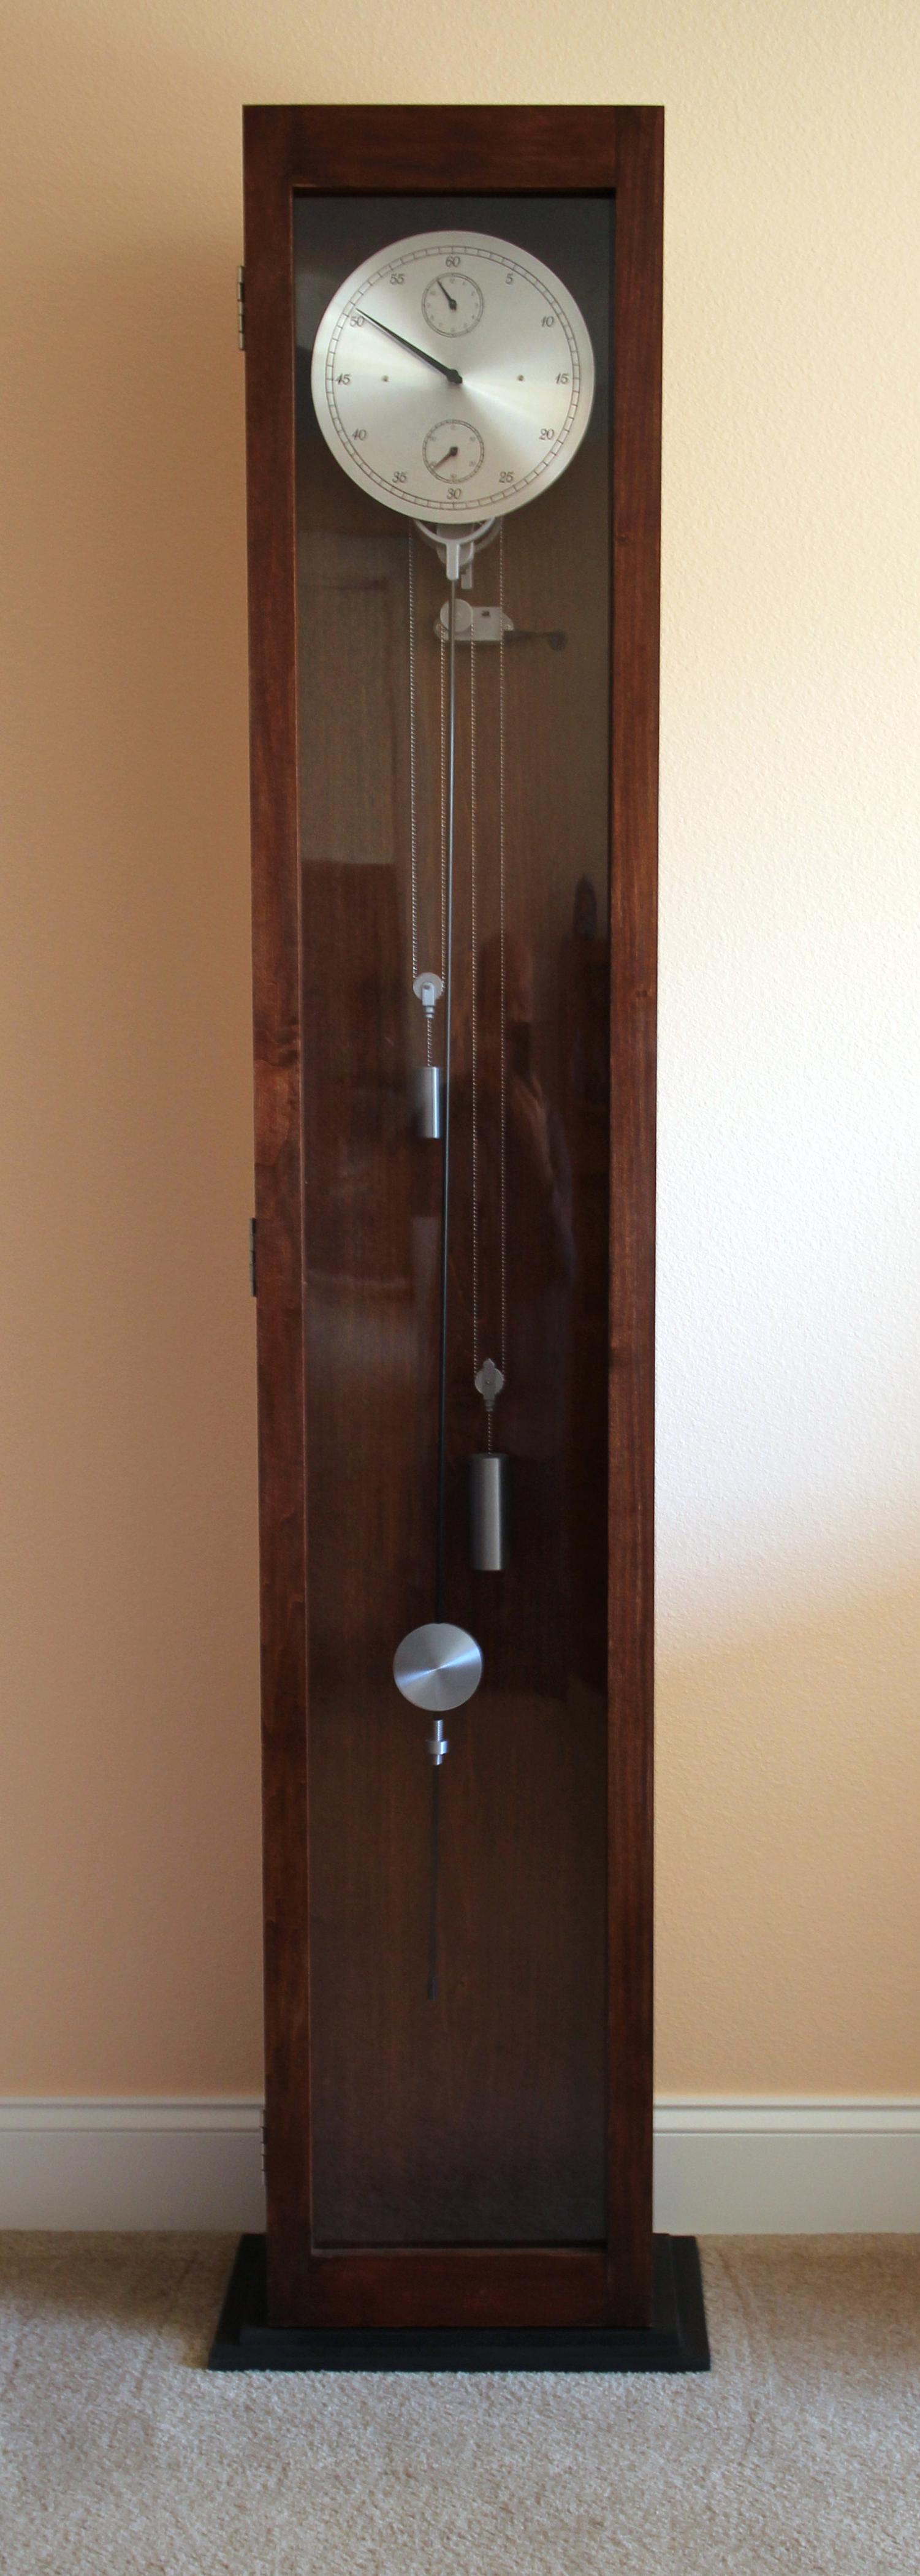
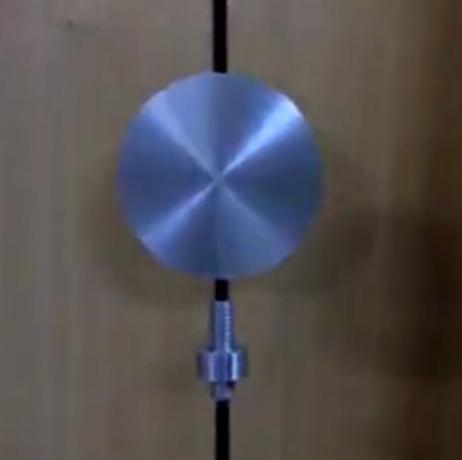 Pendulum bob and adjusting nut.
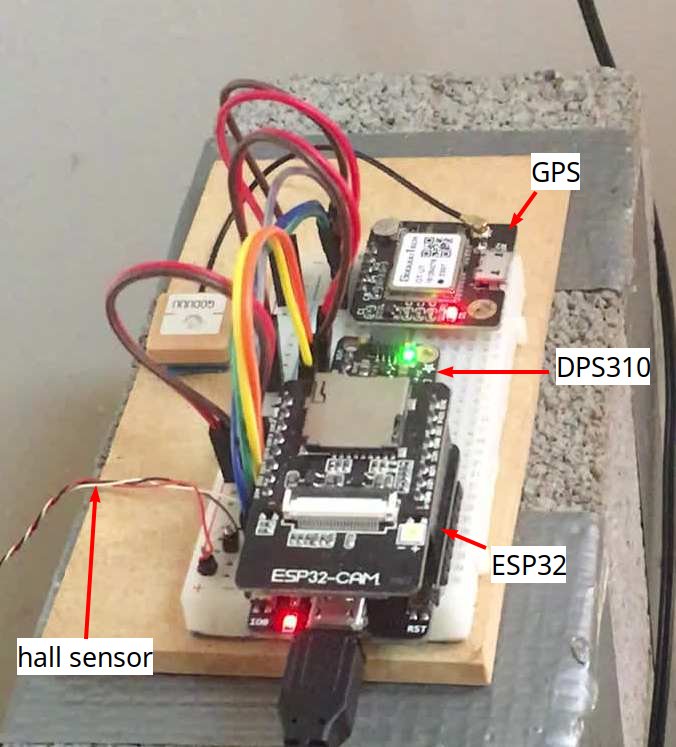
Pulses from the pendulum hall sensor mark the start of each swing.
The gps unit provides date and time information along with a pulse per second output marking the start of each second.
The DPS310 board measures barometric pressure and air temperature.
The ESP32 board collects all of this information every 60 seconds and saves it for downloading on demand via wifi to my laptop.
My laptop software then generates graphs that can be viewed in a web browser, such as those below.
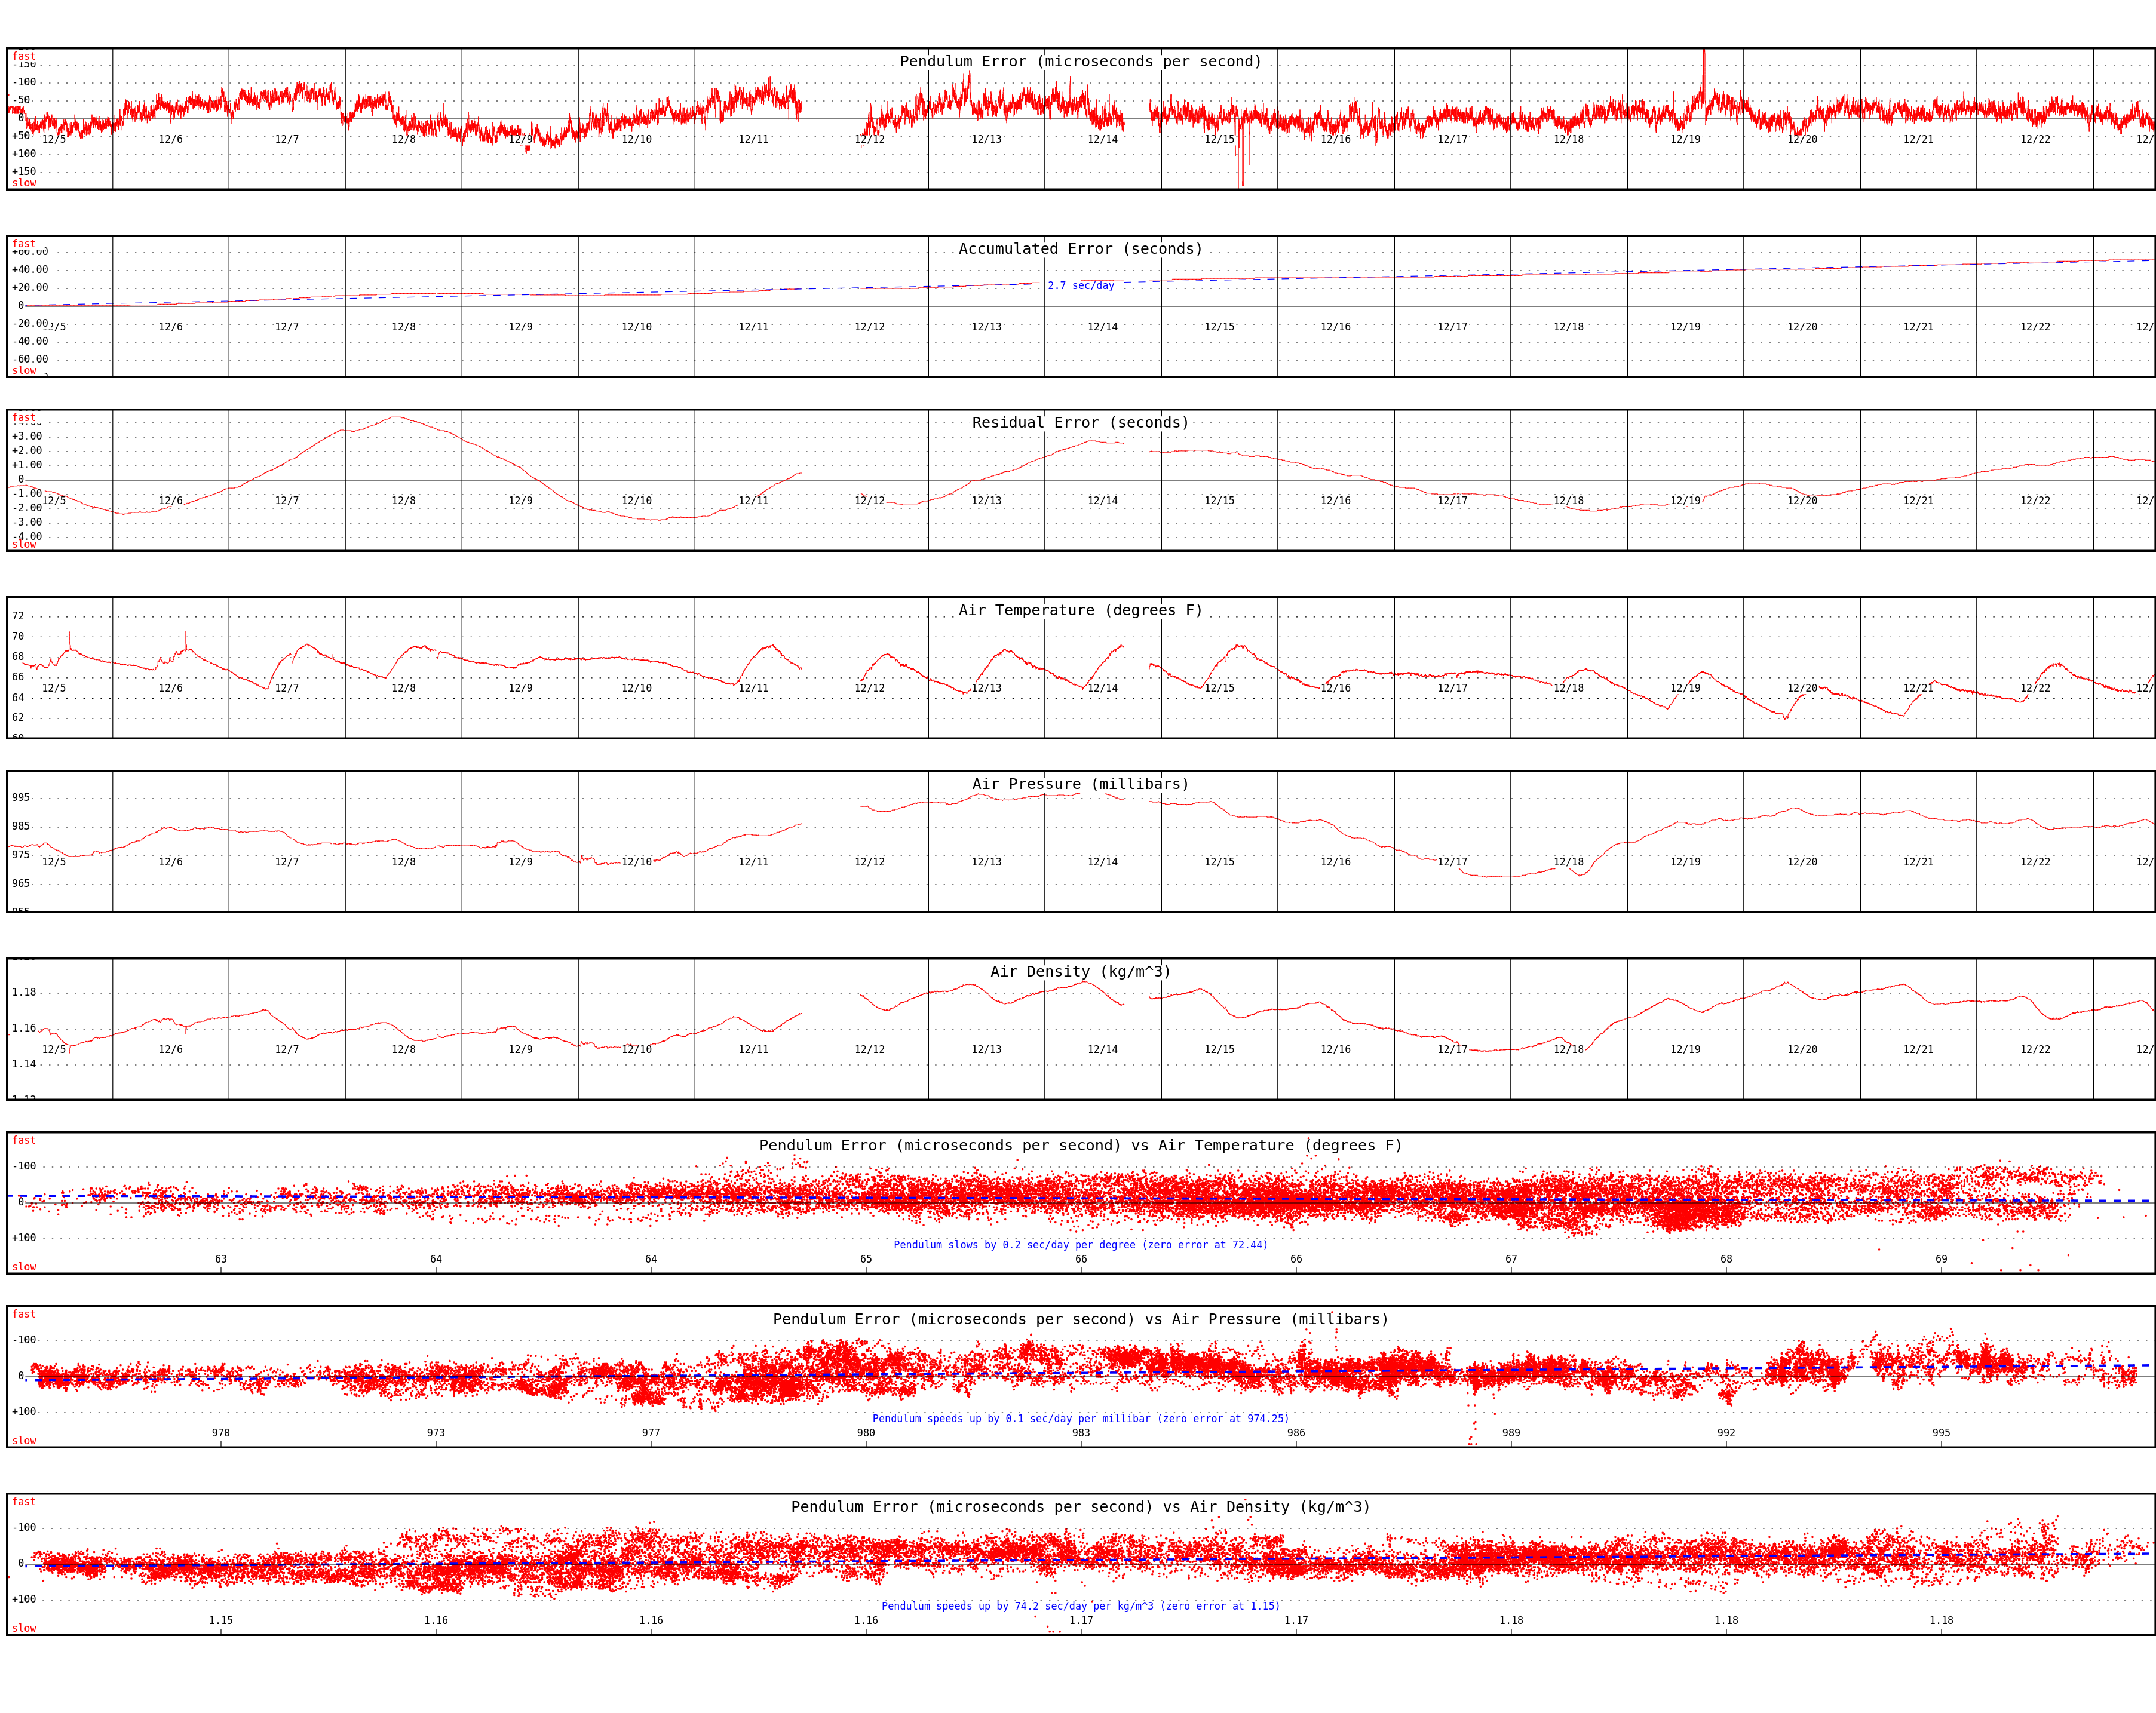
The above graphs summarize about 25,000 measurements spanning 18 days (click the image to enlarge).
There's a lot going on here.
The first graph shows the difference between the actual pendulum period and the idea period (1 second). A negative value indicates the period is too short (clock is running fast). A positive value indicates the period is too long (clock is running slow). The data gaps wee caused by intervals of poor esp32 wifi reception. The two large disturbances were caused by me accidentally bumping the cabinet.
The second graph shows the difference between the indicated clock time and the actual (gps) time. A positive value indicates the clock is running ahead. A negative value indicates the clock is running behind. We see that the clock is gaining about 3 seconds per day, averaged over the 18 days plotted.
In the future, this error can be "tuned out" by turning the pendulum's adjustment thumb screw to (in this case) slightly lower the bob's effective center of gravity.
The third graph shouws the same data as the second, but with the average error subtracted out. This makes it easier to see excursions from the straight line fit. We see that the clock's indicated time meanders up and down about 4 seconds from the mean over the course of several days, especially during the initial "settling in" period.
The next three graphs show the measured air temperature and barometric pressure, followed by the air density calculated for the corresponding temperature, pressure, and relative humidity (which was about 50% during the run).
The final three graphs are "scatter plots" showing the correlation between pendulum period and air temperature, pressure, and density.
As might be expected, the clock runs slower at higher temperatures, which cause the pendulum rod to lengthen due to expansion. This effect is quite small though, presumably because carbon fiber has a low coefficient of expansion compared to, say, brass or steel.
Conversely, the clock runs slightly faster with increasing barometric pressure (and air density). I'm not sure why. Perhaps because increased air drag reduces the pendulum's swing amplitude (lower amplitude = faster swing) ?
Overall I'm quite satisfied with the clock's performance and will probably "declare victory" and move on to new projects.
Web page created 23 Dec 2023 Last updated 13 Mar 2026